Profile based logging for everything | API Maker
API logging keeps track of every request and response, so you can easily monitor how your APIs are working, find issues, and keep things running smoothly. API Maker makes this simple by automatically logging important details like request data, headers, responses, status codes, and how long each call takes.
Developers and product teams can use these logs to spot slow or failing APIs and see how users are interacting with them. In API Maker, you can create log profiles to choose which APIs to track and what details to capture. Once set up, they automatically start recording all matching API calls.
Key Features of API Maker’s Logging System
- Profile-Based Logging: Create multiple log profiles to track specific APIs in different environments like production, staging, or testing. You decide which APIs to include, whether they’re custom, system, third-party, event-based, or schedulers. You can even choose to store full request and response data for deeper debugging.
- Easy Filtering: Quickly narrow down logs using filters like instance, database, collection, API name, or date range. No need to write complex queries, just use the built-in filter panel.
- Full Request & Response Details: Each log captures everything you need: request body, query parameters, headers, response data, status codes, and how long it took. You can see exactly what was sent and received.
- Real-Time Issue Detection: Slow or failing APIs can be easily filtered. You can instantly identify performance issues or errors and start fixing them.
- Downloadable Reports: Easily export logs to Excel or PDF right from the UI. Great for sharing with your team or keeping records for compliance and audits.
- Manage Logs Your Way: Search, and delete logs directly from the dashboard. Once your debugging is done, clean up your logs with just a few clicks.
- Automatic log cleaning: You can setup log cleaning mechanism from root user login. You can decide how many logs to keep for specific time frame and where to store them.
Setting Up Logging in API Maker
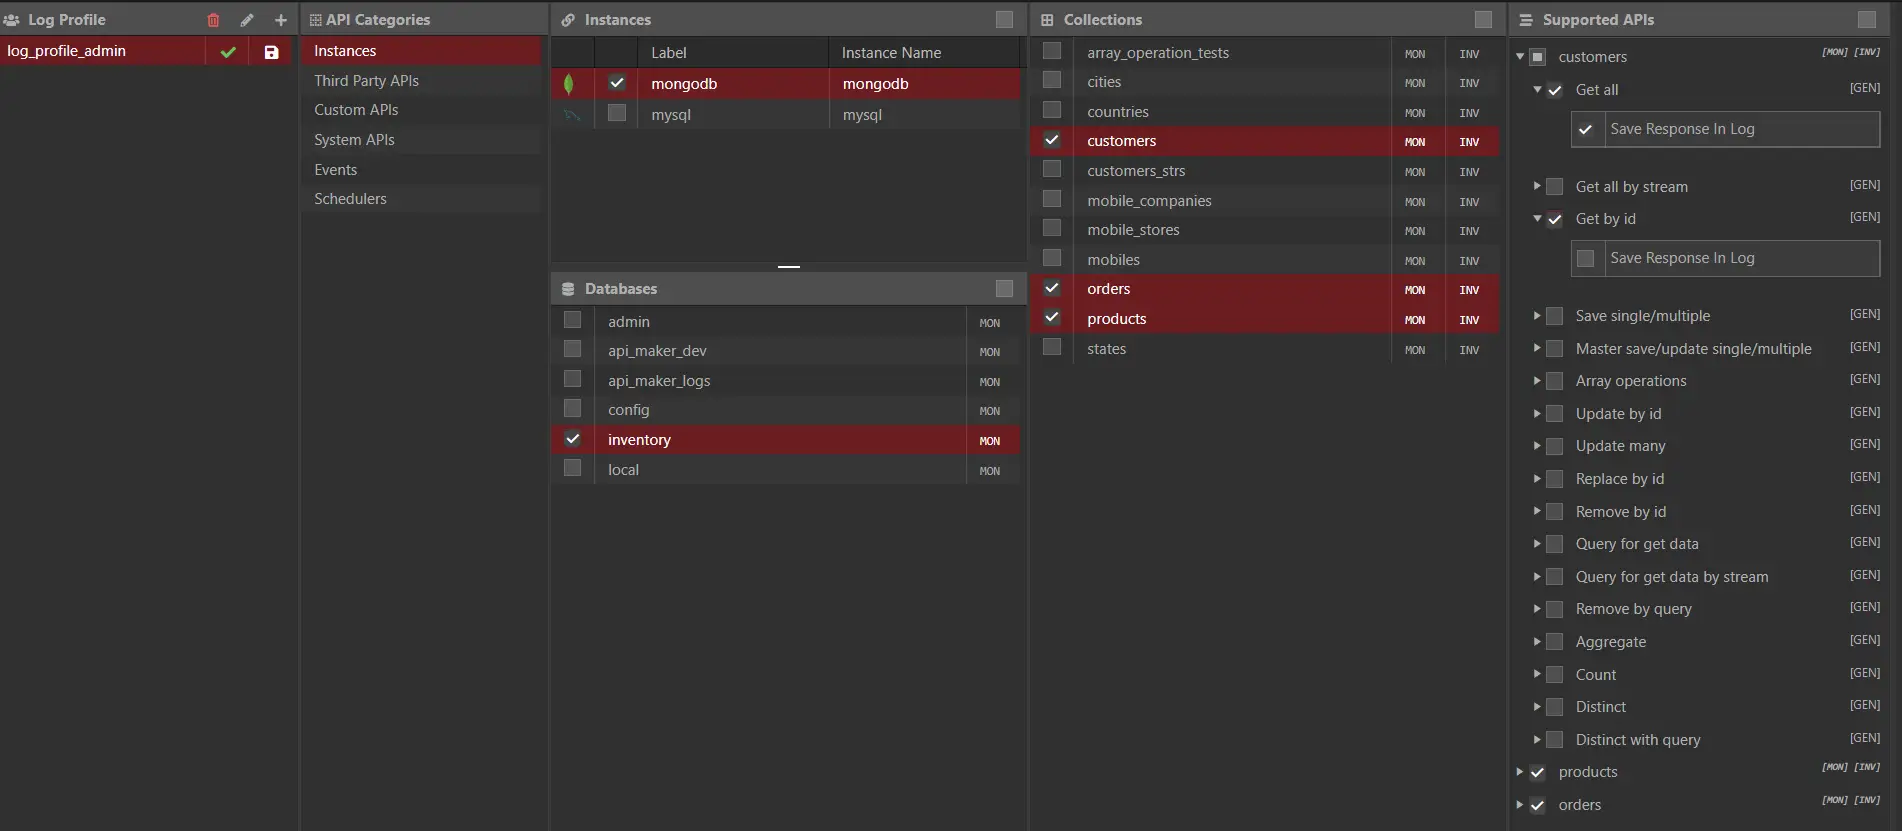
- Creating logs in API Maker is super easy. Just go to the Log Profile section in your dashboard and click “Create New.” Give your profile a name, choose what you want to track (like instances, databases, collections), and select which APIs to include, custom, system, or both.
- You can also choose to log full response data for important & critical API calls for debugging.
- Once the profile is active, API Maker starts capturing all matching API calls right away.
- For example, you could have one profile for your production APIs and another for testing, all separated and easy to manage.
Exploring API Logs in API Maker
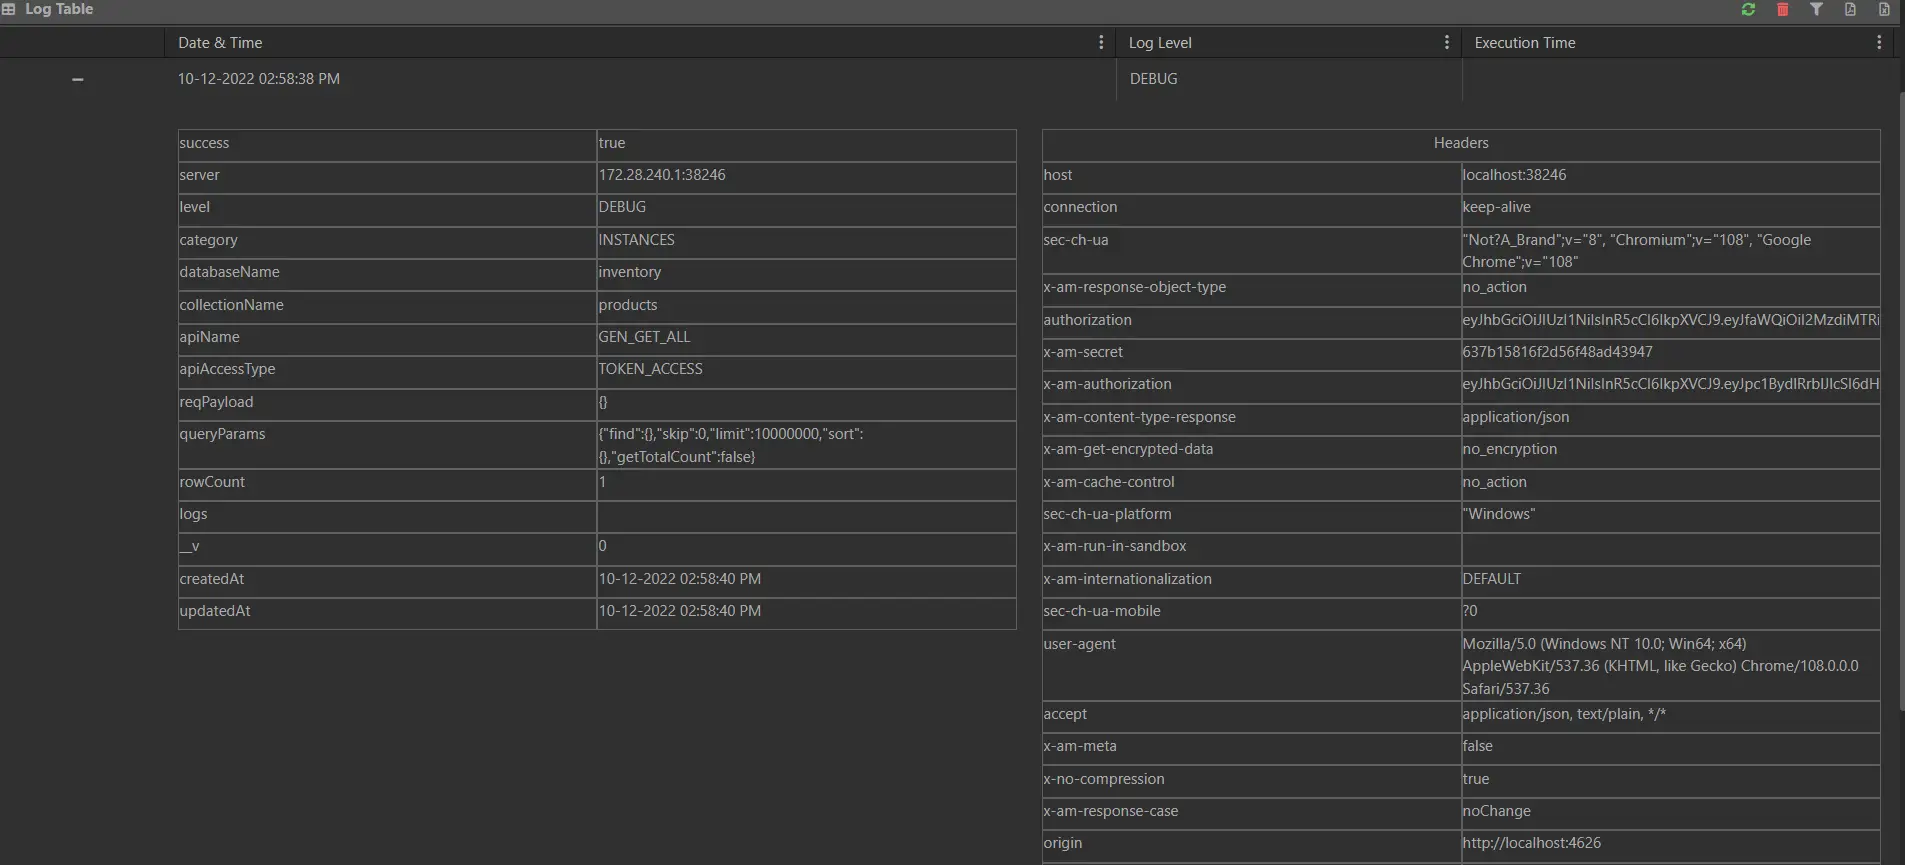
- The Log Table in API Maker gives you a clear view of all saved API calls in an easy-to-use grid.
- We can Filter logs by date, API name, status code, and more using the filter icon.
- Click any log row to expand it and see full details, like request and response headers, body, query parameters, status code, and execution time.
- This helps you quickly understand what happened in any API call, perfect for debugging.
- You can also download logs as Excel or PDF files for sharing or compliance, or delete entries you no longer need.
API Logging with API Maker – Total Visibility, Zero Guesswork
- If your APIs are running blind, you're flying blind too. That’s why API Maker’s built-in API Logging gives you real-time insights, error tracking, and performance monitoring, right out of the box.
- Whether you're debugging a bug, checking how your APIs perform in production, or auditing API access for compliance, our logging system makes it easy to see exactly what happened, when, and why.
Why You Need API Maker’s Logging
- Track Every API Call: Log all incoming and outgoing API requests, including request payload, headers, and responses.
- Built-in Viewer: No need to set up external tools like ELK. Use the powerful log table to explore logs with filters, search, and sorting.
- Profiles & Tables: Define logging profiles to track specific APIs or events. Store logs in dedicated tables for better organization and retention policies.
- Error Catching Made Easy: Instantly see failed requests, stack traces, and response codes, all from your admin panel.
- Real-Time Debugging: Don’t wait for log exports. View live logs as users hit your APIs.
Common Logging Use Cases
- Monitor real-time API traffic
- Debug 500 errors with full request/response context
- Audit third-party API call usage and failures
- Identify slow-performing endpoints
- Track user activity and API abuse attempts
Smart Logging That Adapts to You
- With Logging Profiles, you can log exactly what matters, not everything that moves. Whether you want to log every API request for your CRM or only failures in your payment gateway, API Maker gives you total control.
Comparison with Other Logging Solutions
| Feature | API Maker Logging | Typical Alternative |
|---|---|---|
| Log Profiles | Multiple named profiles; selectively log any combination of APIs and environments. | Usually a single global log setting; fine-grained control requires custom code. |
| Detail Level | Captures request body/params, response body, headers, status codes, timings. | Basic frameworks log request URLs and errors; full payloads or timings need extra setup. |
| Filtering & Search | Advanced UI filters (by API, date, status, etc.) built in. | Typically requires external log management tools or manual searching through raw logs. |
| Exports | One-click download to Excel or PDF from UI. | Export usually requires writing scripts or using ELK/Kibana, with complex setup. |
| Ease of Use | Built into API Maker’s console with visual interface – no coding needed. | Logging often requires developer effort to integrate libraries and dashboards. |
| Structured Logs | API Maker stores log in external MongoDB and they are in structured form so they can easily exported in to elastic search like tools | Logs are in just plain text format |
| Feature | API Maker | Firebase | Supabase | Appwrite |
|---|---|---|---|---|
| Visual Log Viewer | ✅ Yes | ❌ No (CLI only) | ❌ No (limited) | ❌ No (basic UI) |
| Log Profiles | ✅ Customizable | ❌ No | ❌ No | ❌ No |
| Real-time Debugging | ✅ Live logs | ❌ Manual | ❌ Partial | ❌ Partial |
| Error-specific Logging | ✅ Built-in | ❌ No | ❌ No | ❌ No |
FAQs – API Logging in API Maker
1. Do I need to write code to enable logging?
Nope. Just use the UI to enable or configure logging, no code needed.
2. How long are logs stored?
You control that! Set your own retention policies or use dedicated log tables with archiving rules.
3. Can I filter logs for specific users or API endpoints?
Absolutely. Use the log viewer’s advanced filters to drill down by user ID, endpoint, error code, method, and more.
4. Who can use API Maker’s logging features?
The logging UI is designed to be user-friendly. Developers will appreciate the detailed technical data, and product managers or CTOs can use the exports and summaries for reports. Even non-technical users can turn on logging profiles and share download files. Since logs can be filtered and viewed without writing code, monitoring an API’s health becomes accessible to the whole team.
5. What is a Log Profile in API Maker?
A Log Profile is a configuration you create in the API Maker dashboard to specify which APIs should be logged and how. You can make multiple profiles (for example, one for production and one for testing) and activate or deactivate them at any time. The profile allows selecting specific APIs (custom, system, third-party, etc.) and deciding whether to save full request or response data. Only active profiles record logs for their selected APIs.
API Maker’s logging system isn’t just about storing data, it’s about giving developers, PMs, and even non-tech users a window into what’s happening inside their systems. Stop wasting time hunting for bugs in black boxes. Start building APIs with full visibility from day one.
To get specific log result apply filter
- Set filter for instances, databases, collections, and generated APIs level. To get particular API logs.
- The filter can apply to Custom APIs, System APIs, Third-party APIs, Events and Schedulers too.
- Date-wise filter for all logs.
The below properties can be checked in logs.
- API request details like body, params, query params, and headers.
- Response body
- Time is taken by API
- API status code
- View separated logs for each API call.


