The framework for AI era
The framework for AI era
Monitoring in API Maker helps you keep an eye on the health and performance of your backend without setting up any extra tools. As soon as your project is deployed, you get a dashboard that shows how your servers, workers, and databases are doing in real time.
Instead of piecing together different monitoring systems, everything is already built in, so you can quickly spot issues, track resource usage, and make sure your APIs are running smoothly.
With API Maker, monitoring is automatic. The moment you deploy a project, the platform starts tracking your system and application health, so you don’t need to install agents, set up Prometheus or Grafana, or maintain log pipelines.
Here’s what happens in the background:
Data Collection, API Maker captures metrics like CPU, memory, uptime, worker processes, and database connections.
Centralized View, all of this data flows into the Monitoring Dashboard in real time, giving you a single place to check on everything.
Always On, monitoring is enabled by default, so you never miss what’s happening inside your backend.
The Nodes Dashboard gives you a clear picture of how your server is running. It shows real-time information about processes, memory, system details, and database connections, all in one place.
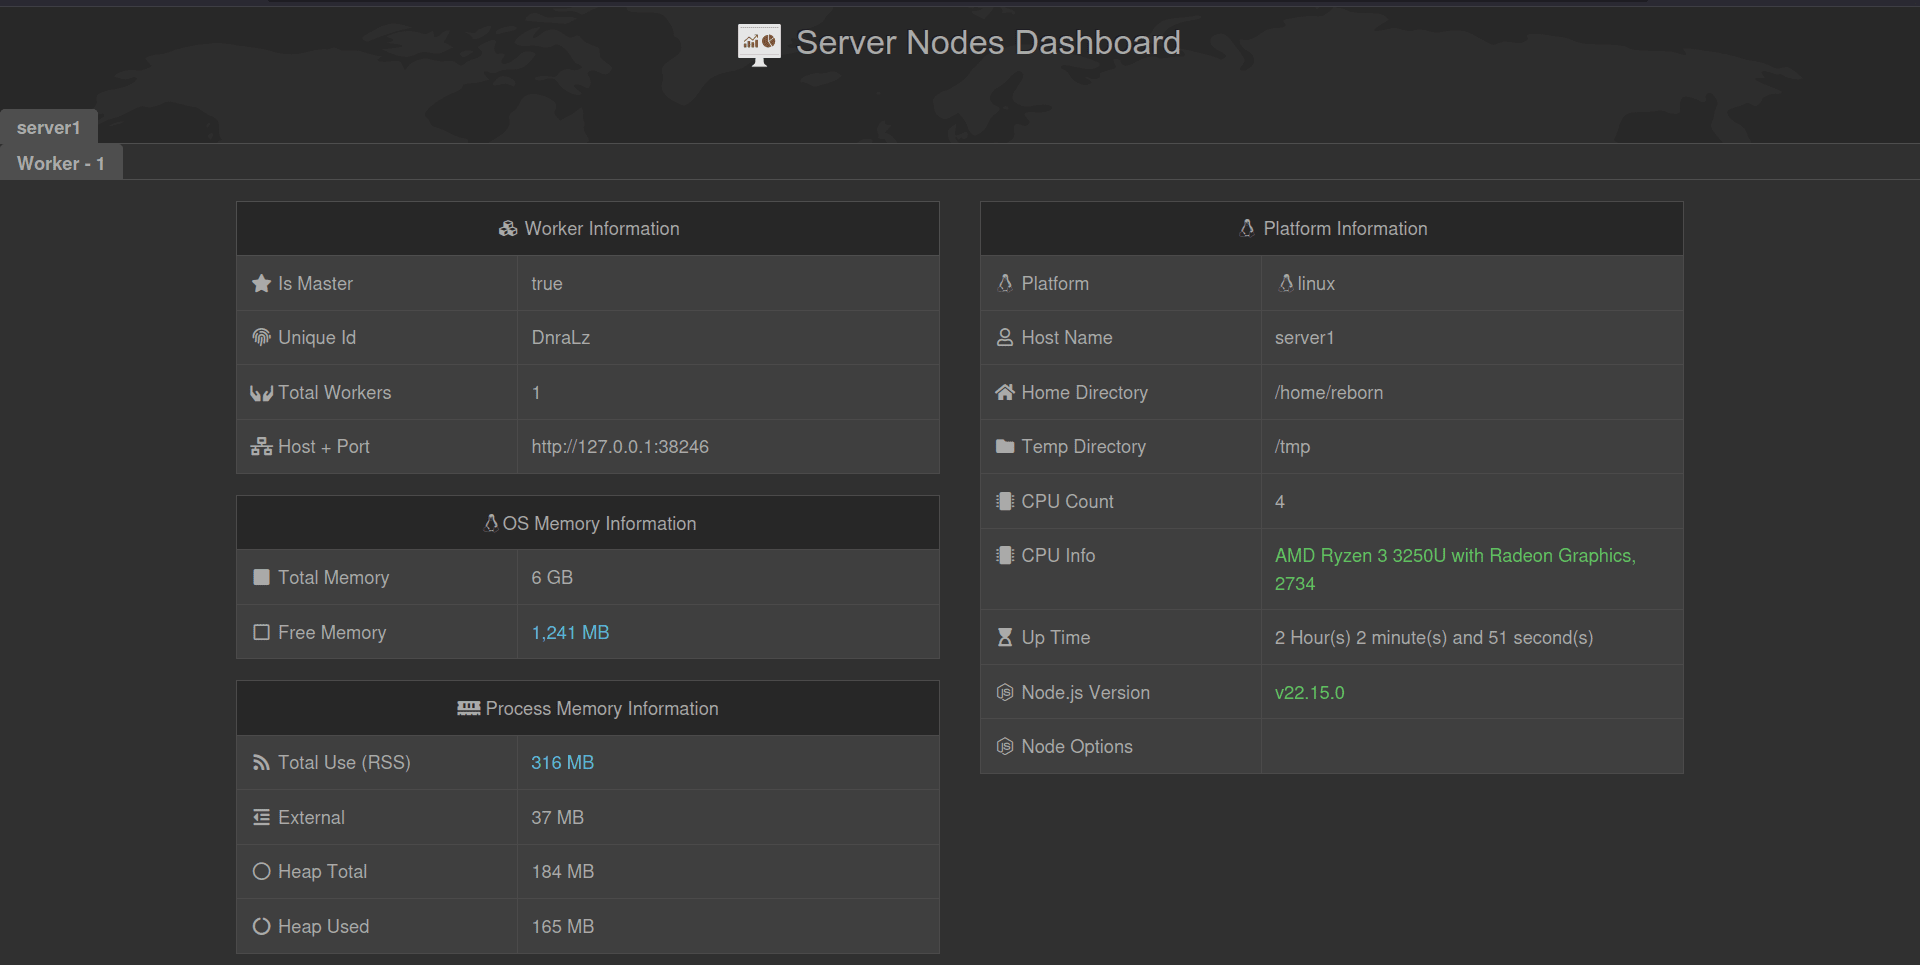

See how many Node.js processes are active, along with their host and port details. This helps confirm how API Maker is distributing the workload.
Check the total and free RAM on the server, so you always know how much memory is available.
Get system details like the host name, home and temp directories, CPU count and model, server uptime, Node.js version, and any active Node options.
Understand how memory is being used by Node.js processes:
RSS (Resident Set Size), the total memory in use, including stack, heap, and code.
Heap Total and Heap Used, memory allocated and currently used by the V8 engine.
External, memory used by C++ objects connected to JavaScript.
See a list of active database connections, including MongoDB, MariaDB, MySQL, and PostgreSQL and the supported databases. You can quickly check maximum allowed connections, shared usage, and availability.
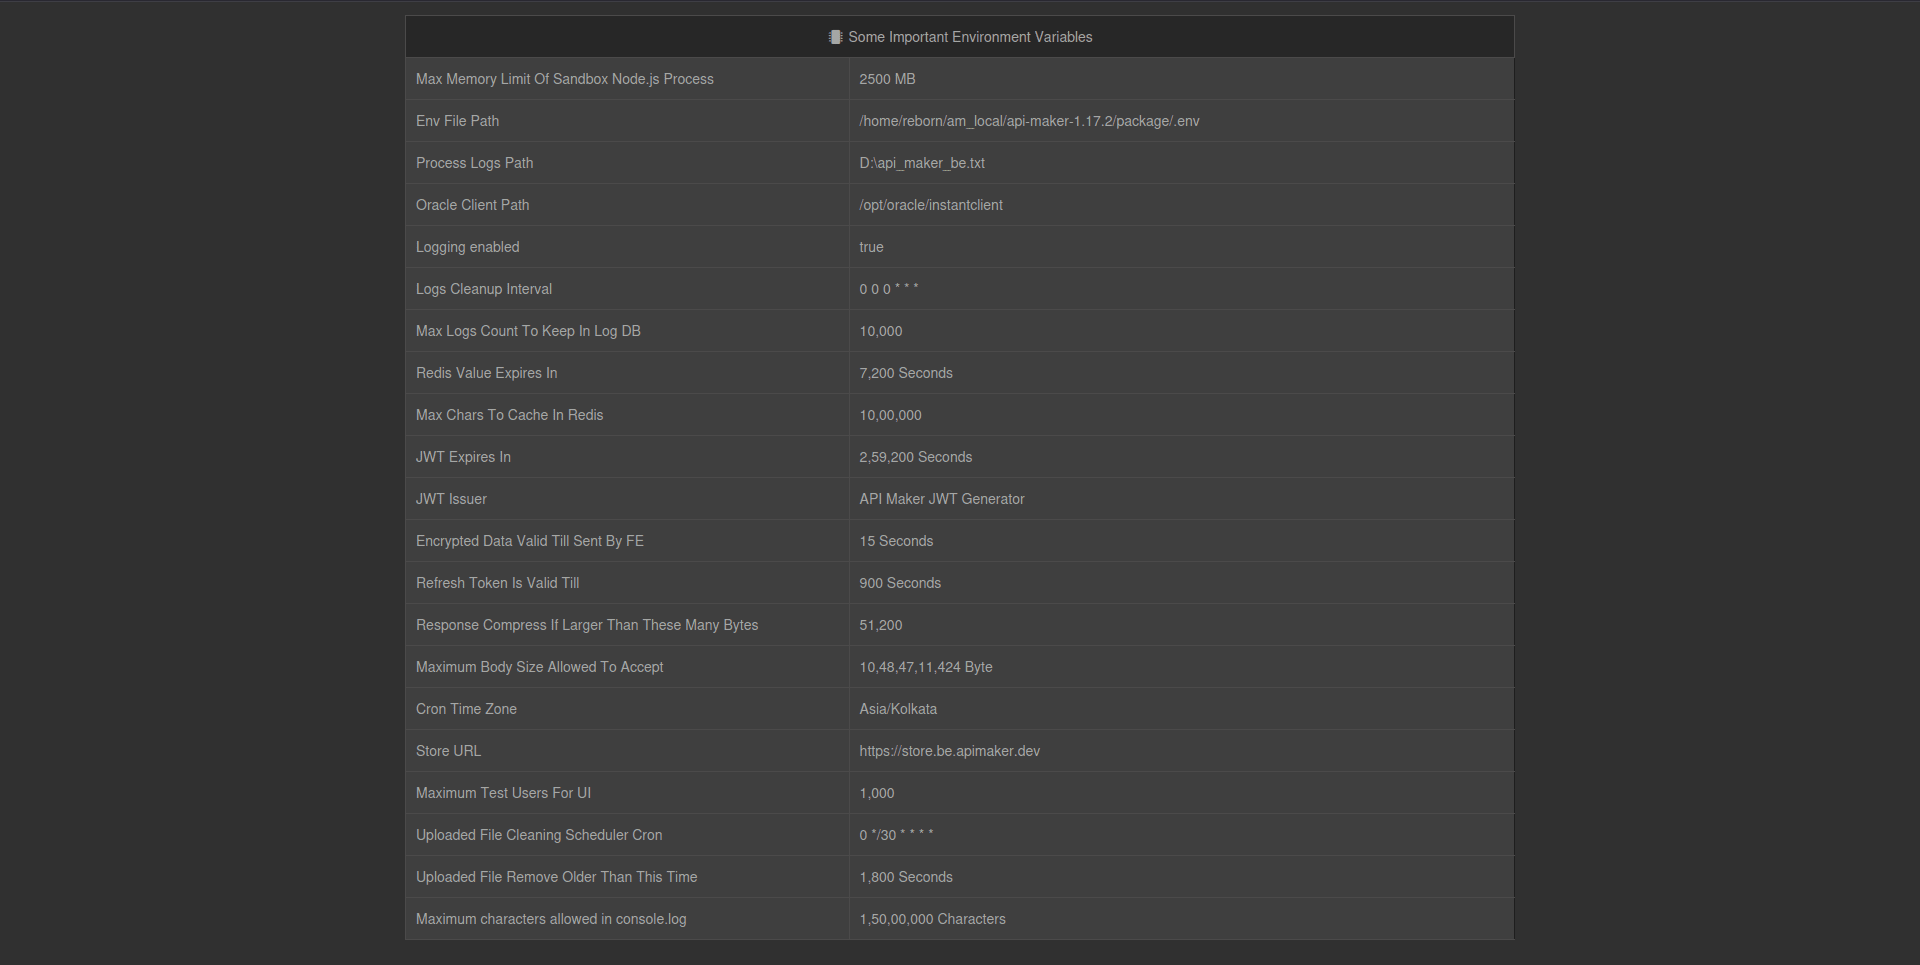
Review important runtime settings, such as memory limits, Redis TTL, JWT expiry, cron jobs, and payload size limits.
Monitoring in API Maker gives you confidence at every stage of running your APIs, whether debugging issues in development or handling traffic in production. With a single view of servers, processes, and databases, it removes guesswork and helps you make decisions backed by real-time data.
When errors occur, you can quickly detect failed requests, memory leaks, or worker crashes directly from the dashboard. This saves time by eliminating the need for external debuggers or sifting through endless logs.
Bottlenecks such as long-running queries or high-latency endpoints become visible immediately in monitoring. With these insights, you can tune specific processes to deliver faster and more reliable API responses.
Unexpected traffic surges or abnormal resource usage often lead to outages if unnoticed. Monitoring highlights unusual spikes early, allowing you to resolve issues before they impact your production systems.
Instead of switching between tools for servers, workers, and databases, you get a single unified dashboard. This complete picture simplifies troubleshooting and ensures no blind spots in your backend environment.
As API usage grows, monitoring shows how resources are consumed over time. These trends help you decide when to add workers, upgrade servers, or optimize queries without overspending.
The Redis Dashboard gives you complete visibility and control over cached data created by your APIs. Whenever caching is enabled for an API and that API is called, API Maker automatically generates a cache entry. These key–value pairs are displayed directly in the dashboard, allowing you to inspect and manage them in real time.
From the dashboard, you can:
In addition to managing existing cache, you can manually create new Redis keys directly from the dashboard. Each key can be assigned a TTL in seconds, defining how long it should remain valid. Once the TTL expires, the key is automatically deleted from Redis, ensuring stale data does not persist.
For more information checkout the Redis Dashboard Section.
The Diagram Dashboard gives you a visual overview of how your active instances, databases, and collections/tables are connected. Instead of browsing through configurations, you can instantly see how everything relates in a single diagram.
From the dashboard, you can:
This visual map helps developers quickly grasp the structure of their backend, troubleshoot connection issues, and plan for future scaling or schema changes.
For more information checkout the ER Diagram Dashboard Section.
No. API Maker has monitoring built-in. You get metrics and dashboards out of the box without extra infrastructure. But you can also setup things like API Gateway before API Maker to get more detailed information of APIs & their performance & responses.
Yes. Monitoring covers everything from CPU/memory usage to API latency, error rates, and worker queue health.
Yes. Monitoring is automatically enabled for every project created in API Maker, no additional setup required.
No. Monitoring runs as a lightweight background process with negligible overhead, ensuring production performance isn’t affected.